Multiple Choice
Draw a scatter plot of the data given in the table.
-The total in billions of dollars of Canadian farm trade surplus to a particular country from 1996 to 1999 is given in the following table.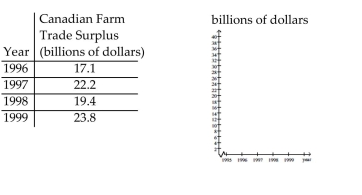
A) billions of dollars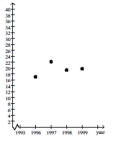
B) billions of dollars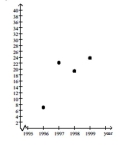
C) billions of dollars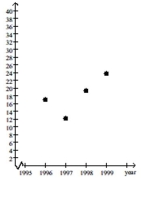
D) billions of dollars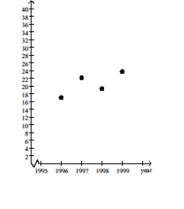
Correct Answer:
Verified
Related Questions
Q102: Evaluate the expression. Q103: Find the midpoint of the line Q104: Find the midpoint of the line Q105: Draw a scatter plot of the data Q106: Draw a scatter plot of the Q108: Find the distance between the points. Unlock this Answer For Free Now! View this answer and more for free by performing one of the following actions Scan the QR code to install the App and get 2 free unlocks Unlock quizzes for free by uploading documents
-
-

