Multiple Choice
Draw a scatter plot of the data given in the table.
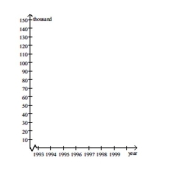
-The number ( ) of computers (in thousands) sold in a certain state for each year from 1994 to 1999 is given in the table below.
A) 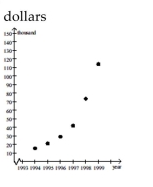
B) 
C) 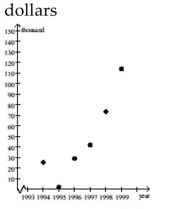
D) 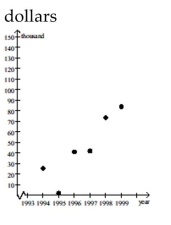
Correct Answer:
Verified
Related Questions
Q101: Find the distance between the points.
-
Q102: Evaluate the expression. Q103: Find the midpoint of the line Q104: Find the midpoint of the line Q105: Draw a scatter plot of the data Q107: Draw a scatter plot of the data Q108: Find the distance between the points.
-
-
Unlock this Answer For Free Now!
View this answer and more for free by performing one of the following actions

Scan the QR code to install the App and get 2 free unlocks

Unlock quizzes for free by uploading documents