The eight panels below show average climatic values across the year on a monthly basis, as represented by first letter of each month depicted on the x-axis. Temperature values are depicted as a line graph and represented by the left vertical axis, while precipitation values are depicted as a bar graph and represented by the right vertical axis. 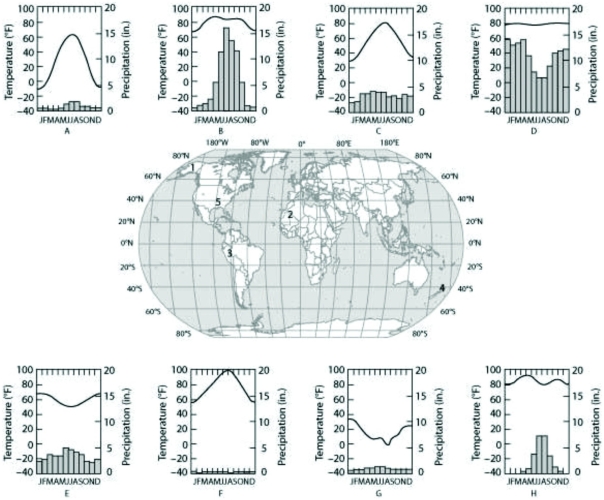 Which panel (A-H) most likely depicts the climate for location 5 as shown on the map in the center panel?
A) A
B) B
C) D
D) H
Correct Answer:
Verified
Q17: If an ecologist were studying the regional
Q18: Subtropical plants are commonplace in Land's End,
Q19: The main reason polar regions are cooler
Q20: Which of the following would be the
Q21: The eight panels below show average climatic
Q23: Which of the following is an important
Q24: Which type of biome is best defined
Q25: Which of the following statements best describes
Q26: Use the following figures to answer the
Q27: Hot deserts are characterized by which of
Unlock this Answer For Free Now!
View this answer and more for free by performing one of the following actions

Scan the QR code to install the App and get 2 free unlocks

Unlock quizzes for free by uploading documents