Use the following figures to answer the question below. The figure depicts average temperatures and total precipitation across the 12 months of the year. Annual precipitation in Area 1 is approximately 260 cm, and in Area 2, 10 cm. 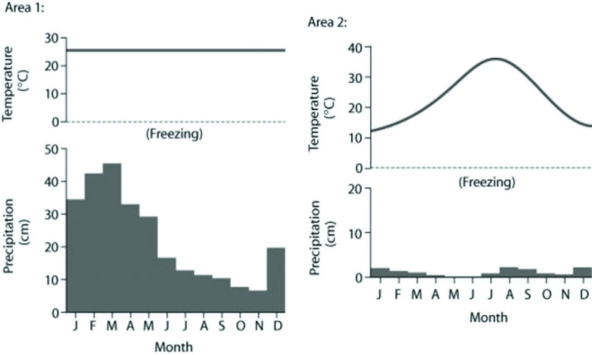 Based on the data in the figures, which of the following statements is most consistent with the data?
A) Area 1 is considered a hot desert because of its high average temperature, and it also has higher average precipitation than Area 2.
B) Area 1 has higher average precipitation than Area 2, and also has a larger annual temperature variation.
C) Area 2 is considered taiga.
D) Area 2 has a larger annual temperature variation, and it is considered a hot desert due to its low annual precipitation.
Correct Answer:
Verified
Q21: The eight panels below show average climatic
Q22: The eight panels below show average climatic
Q23: Which of the following is an important
Q24: Which type of biome is best defined
Q25: Which of the following statements best describes
Q27: Hot deserts are characterized by which of
Q28: The eight panels below show average climatic
Q29: Which of the following biomes spans the
Q30: Which of the following sources of information
Q31: The eight panels below show average climatic
Unlock this Answer For Free Now!
View this answer and more for free by performing one of the following actions

Scan the QR code to install the App and get 2 free unlocks

Unlock quizzes for free by uploading documents