Use the graph to answer the following question. 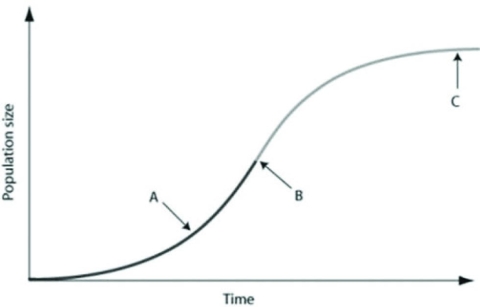 In the figure, which of the arrows represents the carrying capacity?
A) arrow A
B) arrow B
C) arrow C
D) the period of time prior up to arrow A
Correct Answer:
Verified
Q17: Researchers marked 800 turtles in a population,
Q18: Use the table to answer the following
Q19: Which of the following assumptions is applied
Q20: Use the hypothetical or idealized survivorship curves
Q21: Ecologists define carrying capacity (K) as the
Q23: Use the graph to answer the following
Q24: In April 2019, the population in the
Q25: A species population's size (N) may vary
Q26: A population of ground squirrels has an
Q27: Which of the following causes populations to
Unlock this Answer For Free Now!
View this answer and more for free by performing one of the following actions

Scan the QR code to install the App and get 2 free unlocks

Unlock quizzes for free by uploading documents