Use the graph to answer the following question. 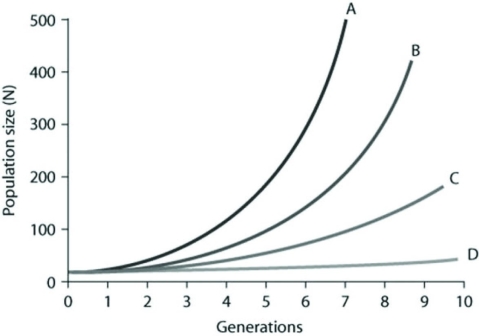 In the figure, curves A-D depict per capita rate increases (r) . Which of the following best explains the difference between the shapes of these curves?
A) The population growth is logistic as generations continue to form.
B) The growth is exponential for curves A and B, but because population growth for C and D is slower, it is considered logistic.
C) Population growth within each curve gets steeper as time passes because growth depends on both per capita rates of increase and current population size.
D) Curve A has the fastest rate of logistic growth.
Correct Answer:
Verified
Q18: Use the table to answer the following
Q19: Which of the following assumptions is applied
Q20: Use the hypothetical or idealized survivorship curves
Q21: Ecologists define carrying capacity (K) as the
Q22: Use the graph to answer the following
Q24: In April 2019, the population in the
Q25: A species population's size (N) may vary
Q26: A population of ground squirrels has an
Q27: Which of the following causes populations to
Q28: An undergraduate student is working in a
Unlock this Answer For Free Now!
View this answer and more for free by performing one of the following actions

Scan the QR code to install the App and get 2 free unlocks

Unlock quizzes for free by uploading documents