Multiple Choice
A graph of 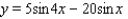 for
for  is shown in the figure. Find the exact values of the x-intercepts.
A) 
B) 
C) 
D) 
E) 
Correct Answer:
Verified
Related Questions
Q63: Find the exact values of 
Q64: Express as a sum or difference.
Q65: Use sum-to-product formulas to find the solutions
Q66: Find the exact value. Q67: Find the identity for the function. Q69: A graph of Q70: Verify the identity. Q71: Verify the identity. Q72: If an earthquake has a total horizontal Q73: Find the exact values of Unlock this Answer For Free Now! View this answer and more for free by performing one of the following actions Scan the QR code to install the App and get 2 free unlocks Unlock quizzes for free by uploading documents![]()
![]()
![]()
![]()

