Multiple Choice
A graph of 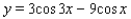 for
for  is shown in the figure. Find the exact values of the x-intercepts.
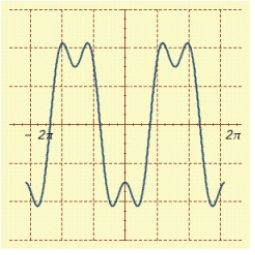
A) 
B) 
C) 
D) 
E) 
Correct Answer:
Verified
Related Questions
Q64: Express as a sum or difference.
Q65: Use sum-to-product formulas to find the solutions


