 Figure 11-3b
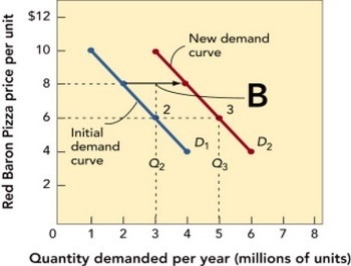
-In Figure 11-3b above, the demand curve shifts from D1 to D2. This most likely represents
A) an increase in demand that did not require a change in price but was the result of a change in one or more demand factors.
B) an increase in demand that required a decrease in price.
C) no change in price and a decrease in demand that results from internal business practice changes.
D) no change in demand or price but a greater profit due to economies of scale.
E) a decrease in price from $8 to $6 per unit.
Correct Answer:
Verified
Q128: Factors that determine consumers' willingness and ability
Q136: The vertical axis of a demand curve
Q141: Which of the following statements about the
Q159: When estimating demand, price is not the
Q166: There are a lot of skateboards on
Unlock this Answer For Free Now!
View this answer and more for free by performing one of the following actions

Scan the QR code to install the App and get 2 free unlocks

Unlock quizzes for free by uploading documents