Multiple Choice
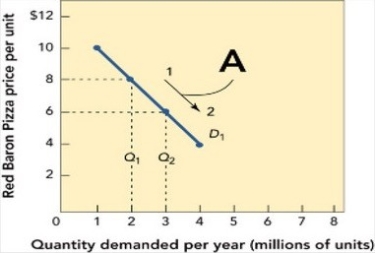 Figure 11-3a
-Figure 11-3a above shows that when the price for Red Baron frozen cheese pizzas moves from $8 to $6 per unit along the demand curve D1, the quantity demanded
A) increases from 2 to 3 million units per year.
B) decreases from 3 to 2 million units per year.
C) stays the same.
D) increases from 6 to 8 million units per year.
E) decreases from 8 to 6 million units per year.
Correct Answer:
Verified
Related Questions
Q126: The horizontal axis of a demand curve
Q136: The vertical axis of a demand curve
Q141: Which of the following statements about the
Q159: When estimating demand, price is not the

