The graph shown displays a market with an externality. 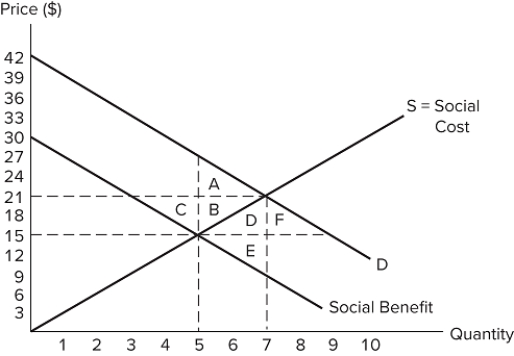 Which areas represent deadweight loss?
A) A + B
B) C + B
C) D + E
D) D + F
Correct Answer:
Verified
Q29: Suppose a company is forced to pay
Q30: If the social cost is greater than
Q31: The graph shown displays a market with
Q32: If a negative consumption externality were present
Q33: When a negative consumption externality is present
Q35: Correcting the externality that is present in
Q36: The graph shown displays a market with
Q37: When private costs equal social costs:
A)negative production
Q38: If a production process causes a negative
Q39: When negative externalities are present in a
Unlock this Answer For Free Now!
View this answer and more for free by performing one of the following actions

Scan the QR code to install the App and get 2 free unlocks

Unlock quizzes for free by uploading documents