The graph shown displays a market with an externality. 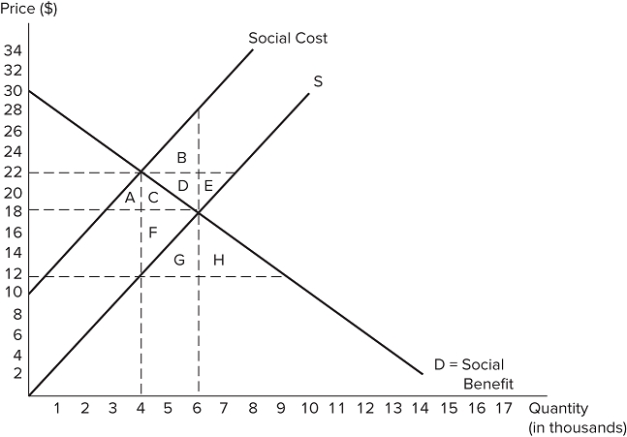 Which areas represent deadweight loss?
A) A + C
B) B + D
C) C + F
D) D + E
Correct Answer:
Verified
Q26: If the social cost is greater than
Q27: The net increase to total surplus when
Q28: The graph shown displays a market with
Q29: Suppose a company is forced to pay
Q30: If the social cost is greater than
Q32: If a negative consumption externality were present
Q33: When a negative consumption externality is present
Q34: The graph shown displays a market with
Q35: Correcting the externality that is present in
Q36: The graph shown displays a market with
Unlock this Answer For Free Now!
View this answer and more for free by performing one of the following actions

Scan the QR code to install the App and get 2 free unlocks

Unlock quizzes for free by uploading documents