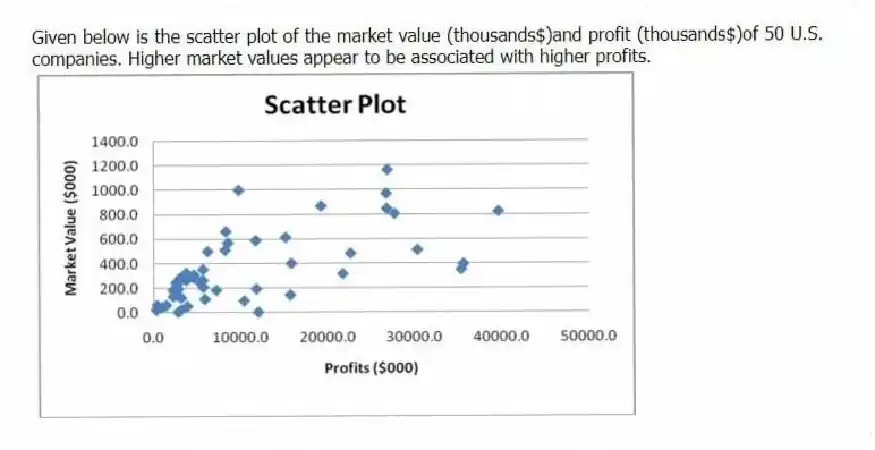
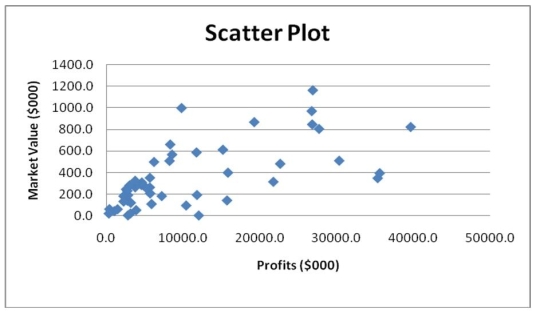
Given below is the scatter plot of the market value (thousands$)and profit (thousands$)of 50 U.S. companies. Higher market values appear to be associated with higher profits.
Correct Answer:
Verified
Q181: TABLE 2-16
The figure below is the percentage
Q196: TABLE 2-14
The table below contains the number
Q199: TABLE 2-18
The stem-and-leaf display below shows the
Q201: TABLE 2-18
The stem-and-leaf display below shows the
Q205: Given below is the scatter plot of
Q205: TABLE 2-18
The stem-and-leaf display below shows the
Q206: Given below is the scatter plot of
Q207: TABLE 2-18
The stem-and-leaf display below shows the
Q207: Given below is the scatter plot of
Q208: TABLE 2-18
The stem-and-leaf display below shows the
Unlock this Answer For Free Now!
View this answer and more for free by performing one of the following actions

Scan the QR code to install the App and get 2 free unlocks

Unlock quizzes for free by uploading documents