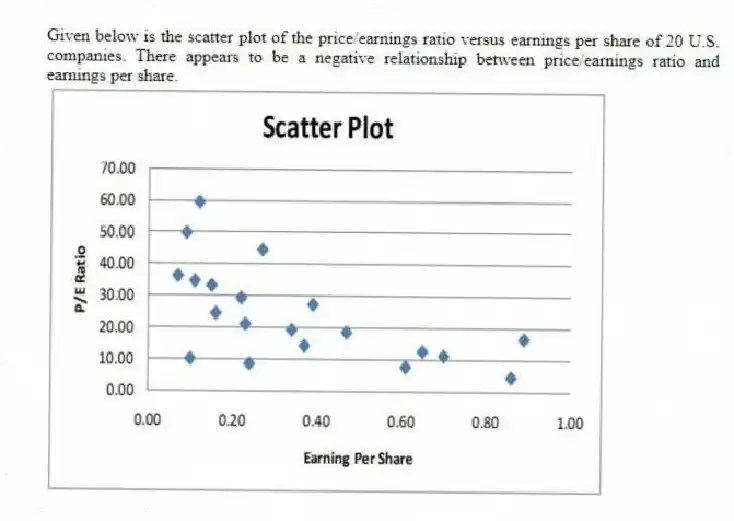
Given below is the scatter plot of the price/earnings ratio versus earnings per share of 20 U.S. companies. There appears to be a negative relationship between price/earnings ratio and earnings per share.

Correct Answer:
Verified
Q199: TABLE 2-18
The stem-and-leaf display below shows the
Q201: TABLE 2-18
The stem-and-leaf display below shows the
Q203: Given below is the scatter plot of
Q205: TABLE 2-18
The stem-and-leaf display below shows the
Q206: Given below is the scatter plot of
Q207: TABLE 2-18
The stem-and-leaf display below shows the
Q207: Given below is the scatter plot of
Q208: TABLE 2-18
The stem-and-leaf display below shows the
Q209: Given below is the scatter plot of
Q210: Given below is the scatter plot of
Unlock this Answer For Free Now!
View this answer and more for free by performing one of the following actions

Scan the QR code to install the App and get 2 free unlocks

Unlock quizzes for free by uploading documents