Figure: The Socially Optimal Quantity of Pollution 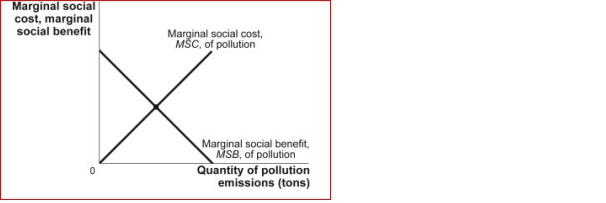 (Figure: The Socially Optimal Quantity of Pollution) In the figure The Socially Optimal Quantity of Pollution, without government intervention:
A) firms will continue to pollute until the marginal social benefit is zero.
B) firms will continue to pollute until the marginal social benefit is $200.
C) the optimal quantity of pollution will occur.
D) The outcome cannot be determined without more information.
Correct Answer:
Verified
Q131: Which of the following is usually associated
Q136: Use the following to answer questions:
Q138: Use the following to answer questions:
Q149: Q150: Figure: Efficiency and Pollution Q151: Figure: The Socially Optimal Quantity of Pollution Unlock this Answer For Free Now! View this answer and more for free by performing one of the following actions Scan the QR code to install the App and get 2 free unlocks Unlock quizzes for free by uploading documents![]()
(Figure: Efficiency and Pollution)

