Figure: The Socially Optimal Quantity of Pollution 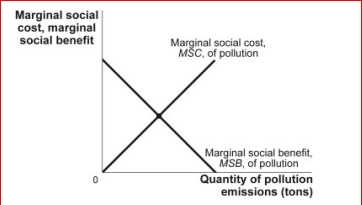
 (Figure: The Socially Optimal Quantity of Pollution) In the figure The Socially Optimal Quantity of Pollution, the optimal level of pollution is:
A) zero, since no pollution is best for society.
B) where the marginal social benefit curve intersects the quantity axis.
C) where the marginal social cost curve intersects the quantity axis.
D) where the marginal social benefit curve intersects the marginal social cost curve.
Correct Answer:
Verified
Q131: Which of the following is usually associated
Q136: Use the following to answer questions:
Q138: Use the following to answer questions:
Q139: Use the following to answer questions:
Q147: Figure: Efficiency and Pollution Q149: Q150: Figure: Efficiency and Pollution Q153: Figure: The Socially Optimal Quantity of Pollution Unlock this Answer For Free Now! View this answer and more for free by performing one of the following actions Scan the QR code to install the App and get 2 free unlocks Unlock quizzes for free by uploading documents![]()
![]()
(Figure: Efficiency and Pollution)

