The 2019 and 2020 market share data of the three competitors (A, B, and C) in an oligopolistic industry are presented in the following pie charts.Total sales for this industry were $1.5 billion in 2019 and $1.8 billion in 2020.Company C's sales in 2020 were ___. 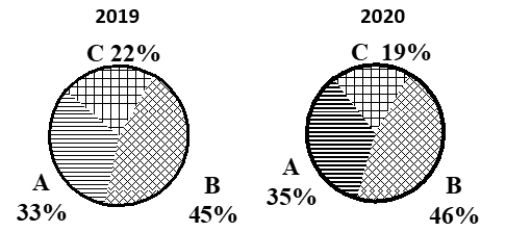
A) $342 million
B) $630 million
C) $675 million
D) $828 million
E) $928 million
Correct Answer:
Verified
Q71: The following graphic of PCB Failures is
Q72: The following graphic of residential housing data
Q73: The staff of Mr.Wayne Wertz, VP of
Q74: The staff of Mr.Wayne Wertz, VP of
Q75: According to the following graphic, "Bent Pins"
Q77: The staff of Mr.Wayne Wertz, VP of
Q78: The staff of Mr.Wayne Wertz, VP of
Q79: The following graphic of residential housing data
Q80: Each day, the office staff at Oasis
Q81: A shirt production company has tracked their
Unlock this Answer For Free Now!
View this answer and more for free by performing one of the following actions

Scan the QR code to install the App and get 2 free unlocks

Unlock quizzes for free by uploading documents