The following graphic of PCB Failures is a ___. 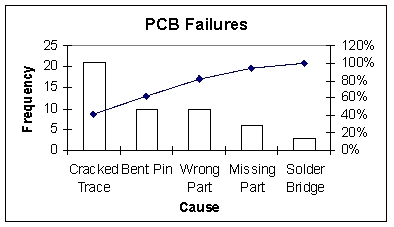
A) scatter Plot
B) Pareto Chart
C) pie chart
D) cumulative histogram chart
E) line diagram
Correct Answer:
Verified
Q61: An instructor has decided to graphically represent
Q66: According to the following graphic the most
Q67: The staff of Mr.Wayne Wertz, VP of
Q68: Suppose a market survey of 200 consumers
Q69: Each day, the office staff at Oasis
Q72: The following graphic of residential housing data
Q73: The staff of Mr.Wayne Wertz, VP of
Q74: The staff of Mr.Wayne Wertz, VP of
Q75: According to the following graphic, "Bent Pins"
Q76: The 2019 and 2020 market share data
Unlock this Answer For Free Now!
View this answer and more for free by performing one of the following actions

Scan the QR code to install the App and get 2 free unlocks

Unlock quizzes for free by uploading documents