The following bar graph shows the annual attendance at a state fair: 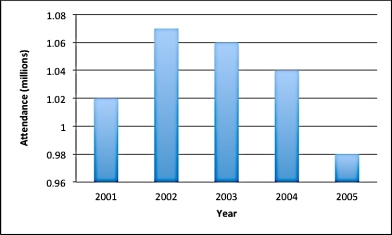 You are asked to redesign the bar chart to DE-EMPHASIZE the change in attendance. You would use a _____ range on the _____ axis.
A) narrower; vertical
B) wider; vertical
C) narrower; horizontal
D) wider; horizontal
Correct Answer:
Verified
Q59: As we grow up, we get taller.
Q60: When we adjust a graph for inflation,
Q61: The following bar graph shows the annual
Q62: The following bar graph shows the annual
Q63: The following table shows the average price
Q65: From 1970 to 2010, the inflation rate
Q66: The inflation rate from 1980 to 2010
Q67: The following table shows average prices per
Q68: The following table shows the average price
Q69: The inflation rate from 2001 to 2007
Unlock this Answer For Free Now!
View this answer and more for free by performing one of the following actions

Scan the QR code to install the App and get 2 free unlocks

Unlock quizzes for free by uploading documents