The following bar graph shows the annual attendance at a state fair: 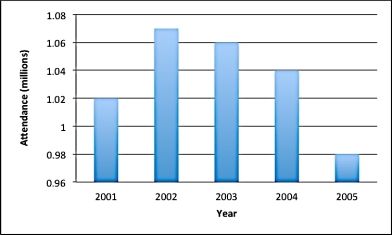 The chart seems to show a sharp increase in attendance from 2001 to 2002. Calculate the percentage change from 2001 to 2002.
A) 25%
B) 15%
C) 10%
D) 5%
Correct Answer:
Verified
Q56: Which of the following descriptions of a
Q57: A company's number of sales each year
Q58: According to a report, the percentage of
Q59: As we grow up, we get taller.
Q60: When we adjust a graph for inflation,
Q62: The following bar graph shows the annual
Q63: The following table shows the average price
Q64: The following bar graph shows the annual
Q65: From 1970 to 2010, the inflation rate
Q66: The inflation rate from 1980 to 2010
Unlock this Answer For Free Now!
View this answer and more for free by performing one of the following actions

Scan the QR code to install the App and get 2 free unlocks

Unlock quizzes for free by uploading documents