In an investigation of the visual scanning behavior of deaf children, measurements of eye movement rates were taken on nine deaf and nine hearing children as shown in the table below. 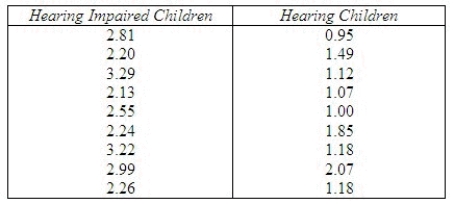 Does it appear that the distributions of eye-movement rates for deaf children and hearing children differ? Test at
  = 0.05 using the Wilcoxon rank sum test.
The null and alternate hypotheses are:  : The distributions of eye-movement rates for hearing impaired children and hearing children are identical.
  : The distributions of eye-movement rates for hearing impaired children and hearing children are different.
What is the test statistic?
T: ______________
What is the critical value for the test statistic?
______________
Thus: ______________
Conclude:
We conclude that the hearing impaired children ______________ from the hearing children in eye-movement rate.
Correct Answer:
Verified
View Answer
Unlock this answer now
Get Access to more Verified Answers free of charge
Q188: Suppose you want to use the Wilcoxon
Q189: The Wilcoxon rank sum test (like most
Q190: Use the Wilcoxon rank sum test on
Q191: Consider the following data set: 2.2, 2.3,
Q192: Because of the rising costs of industrial
Q193: In testing the hypotheses:
H0: The two population
Q194: Given the statistics: n1 = 6, n2
Q195: To investigate the effect of sleep on
Q196: A vendor was interested in determining whether
Q197: Use the Wilcoxon rank sum test on
Unlock this Answer For Free Now!
View this answer and more for free by performing one of the following actions

Scan the QR code to install the App and get 2 free unlocks

Unlock quizzes for free by uploading documents