Multiple Choice
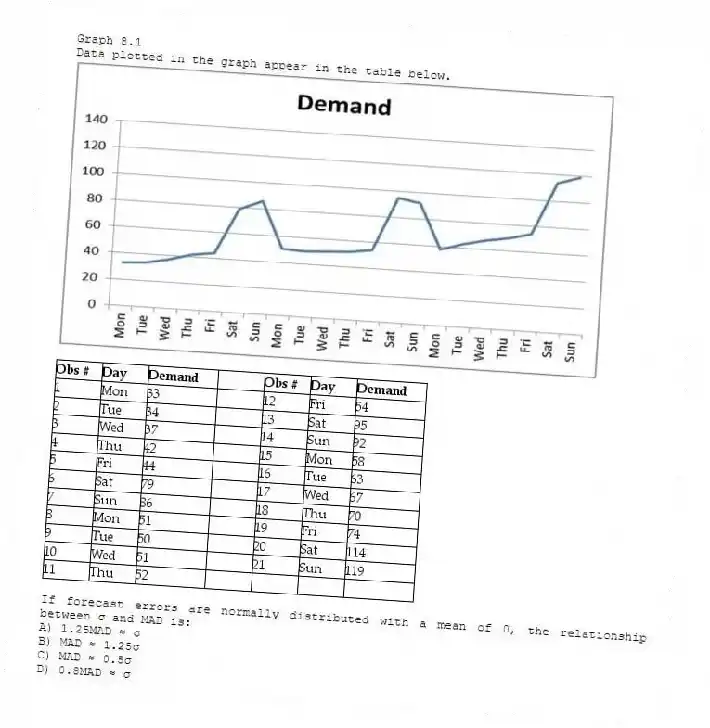
Graph 8.1
Data plotted in the graph appear in the table below.


-If forecast errors are normally distributed with a mean of 0, the relationship between σ and MAD is:
A) 1.25MAD ≈ σ
B) MAD ≈ 1.25σ
C) MAD ≈ 0.5σ
D) 0.8MAD ≈ σ
Correct Answer:
Verified
Related Questions
Q102: Table 8.9
Consider the following results from the
Q103: Graph 8.1
Data plotted in the graph appear
Q104: Table 8.5 Q105: Graph 8.1 Q106: Table 8.7 Q108: Graph 8.1
![]()
Data plotted in the graph appear
A sales manager wants to forecast
Data plotted in the graph appear
Unlock this Answer For Free Now!
View this answer and more for free by performing one of the following actions

Scan the QR code to install the App and get 2 free unlocks

Unlock quizzes for free by uploading documents