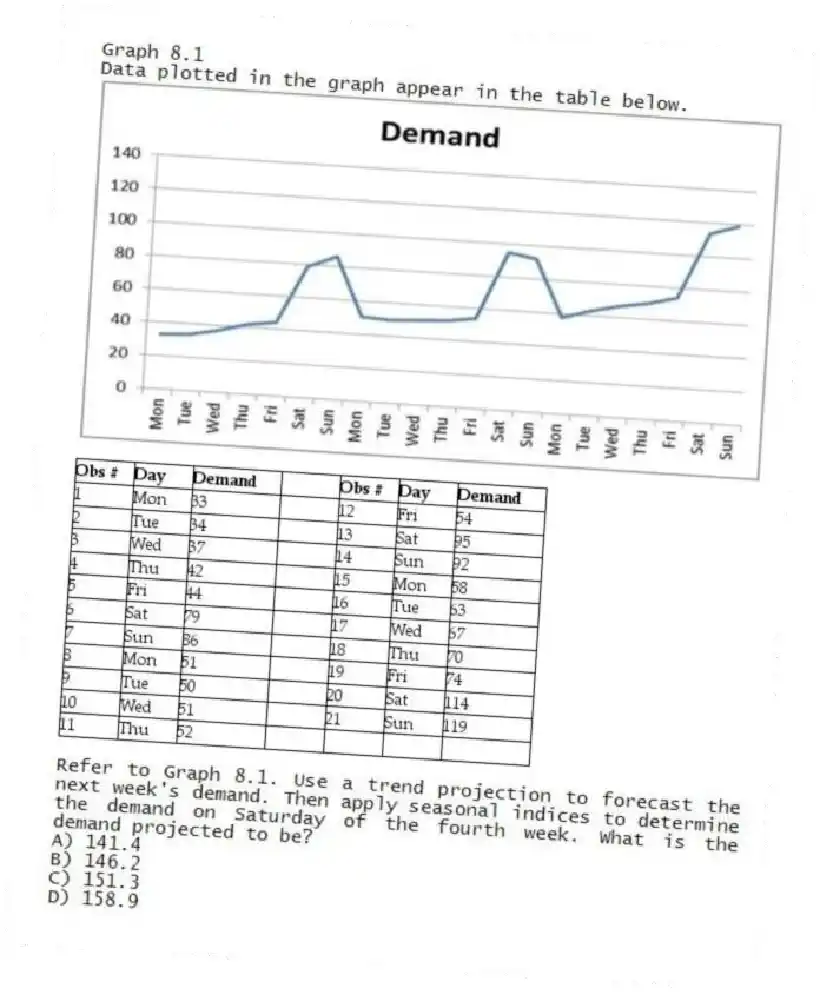
Graph 8.1
Data plotted in the graph appear in the table below.


-Refer to Graph 8.1. Use a trend projection to forecast the next week's demand. Then apply seasonal indices to determine the demand on Saturday of the fourth week. What is the demand projected to be?
A) 141.4
B) 146.2
C) 151.3
D) 158.9
Correct Answer:
Verified
Q100: The trend projection with regression model can
Q101: Table 8.6 Q102: Table 8.9 Q103: Graph 8.1 Q104: Table 8.5 Q106: Table 8.7 Q107: Graph 8.1 Q108: Graph 8.1 Q109: Table 8.6 Q110: Table 8.7 Unlock this Answer For Free Now! View this answer and more for free by performing one of the following actions Scan the QR code to install the App and get 2 free unlocks Unlock quizzes for free by uploading documents
![]()
Consider the following results from the
Data plotted in the graph appear
![]()
A sales manager wants to forecast
Data plotted in the graph appear
Data plotted in the graph appear
![]()
A sales manager wants to forecast

