The following figure gives both supply and demand curves for a certain product. If the price is $50 per item, how many items will the consumers buy? 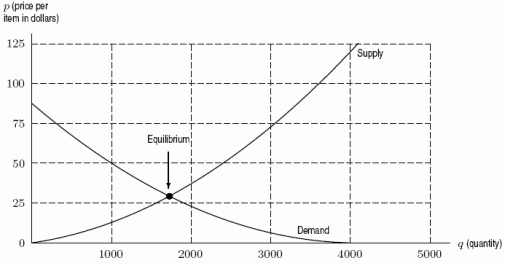
A) 1000
B) 2400
C) 1700
D) 4000
Correct Answer:
Verified
Q16: From the following table,
A. Find f(4)
B. Find
Q17: Suppose that Q18: The average weight in pounds of American Q19: Do you expect the average rate of Q20: Could the following table represent a linear Q22: A premium ice cream company finds that Q23: The following table gives the number of Q24: A textbook company had fixed costs of Q25: The following graph shows the quantity of Q26: Suppose that ![]()
![]()
Unlock this Answer For Free Now!
View this answer and more for free by performing one of the following actions

Scan the QR code to install the App and get 2 free unlocks

Unlock quizzes for free by uploading documents