Multiple Choice
The following graph shows the quantity of goods purchased by consumers at various prices. If the price is $15 per item, how many items do consumers purchase? 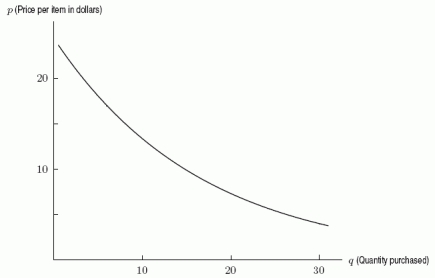
A) 5
B) 8
C) 12
D) 15
Correct Answer:
Verified
Related Questions
Q20: Could the following table represent a linear
Q21: The following figure gives both supply and
Q22: A premium ice cream company finds that
Q23: The following table gives the number of
Q24: A textbook company had fixed costs of
Q26: Suppose that Q27: The following figure gives both supply and![]()
Unlock this Answer For Free Now!
View this answer and more for free by performing one of the following actions

Scan the QR code to install the App and get 2 free unlocks

Unlock quizzes for free by uploading documents