Multiple Choice
Below is a graph of the rate r in arrivals per minute at which students line up for breakfast. The first people arrive at 6:50 am and the line opens at 7:00 am. The line serves students at a constant rate of 20 students per minute. Estimate the time at which the line disappears. 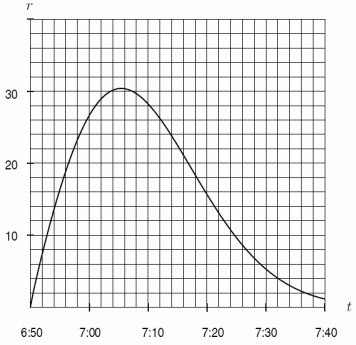
A) 7:10 am or earlier
B) 7:20 am
C) 7:30 am
D) 7:40 am or later
Correct Answer:
Verified
Related Questions
Q82: The following figure shows the rate of
Q83: Data for a function G is given
Q84: Data for a function G is given
Q85: An air conditioning unit is switched on

