Below is a graph of the rate r in arrivals per minute at which students line up for breakfast. The first people arrive at 6:50 am and the line opens at 7:00 am. The line serves students at a constant rate of 20 students per minute. Estimate the length of time a person who arrives at 7:00 has to stand in line. 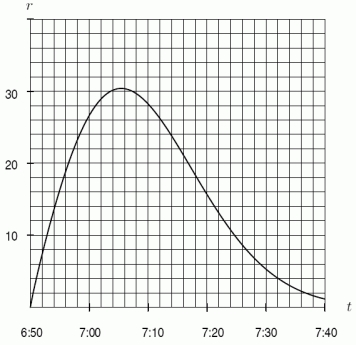
A) 1.5 minutes
B) 3.5 minutes
C) 7.5 minutes
D) 11.5 minutes
Correct Answer:
Verified
Q83: Data for a function G is given
Q84: Data for a function G is given
Q85: An air conditioning unit is switched on
Q86: If Q87: Below is a graph of the rate Q88: Below is a graph of the rate Q89: Below is a graph of the rate Unlock this Answer For Free Now! View this answer and more for free by performing one of the following actions Scan the QR code to install the App and get 2 free unlocks Unlock quizzes for free by uploading documents![]()

