The following figure shows the rate of change of enrollment for a community college. Estimate the total change in enrollment over the first 6 years. 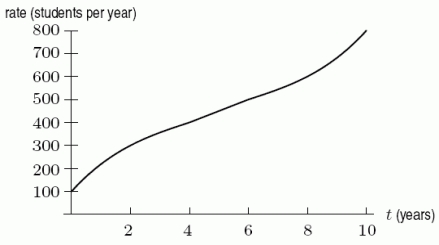
A) 1900 students
B) 2300 students
C) 2700 students
D) 2900 students
Correct Answer:
Verified
Q2: Consider a sports car which accelerates from
Q3: Find Q4: The flow rate of water in a Q5: The rate of pollution pouring into a Q6: Consider a sports car which accelerates from Q7: Use a calculator to evaluate Q8: Use a calculator to evaluate Q9: The following figure shows the graph of Q10: At time t, in seconds, the velocity Q11: Two cars start at the same time![]()

Unlock this Answer For Free Now!
View this answer and more for free by performing one of the following actions

Scan the QR code to install the App and get 2 free unlocks

Unlock quizzes for free by uploading documents