Solved

The Following Graph Represents the Rate of Change of a Function

Question 110

Short Answer

The following graph represents the rate of change of a function f with respect to x; i.e., it is the graph of The following graph represents the rate of change of a function f with respect to x; i.e., it is the graph of   , with   . Find a value a to one decimal place such that   and   . If there is no such value, enter  none .  , with The following graph represents the rate of change of a function f with respect to x; i.e., it is the graph of   , with   . Find a value a to one decimal place such that   and   . If there is no such value, enter  none .  . Find a value a to one decimal place such that The following graph represents the rate of change of a function f with respect to x; i.e., it is the graph of   , with   . Find a value a to one decimal place such that   and   . If there is no such value, enter  none .  and The following graph represents the rate of change of a function f with respect to x; i.e., it is the graph of   , with   . Find a value a to one decimal place such that   and   . If there is no such value, enter  none .  . If there is no such value, enter "none".
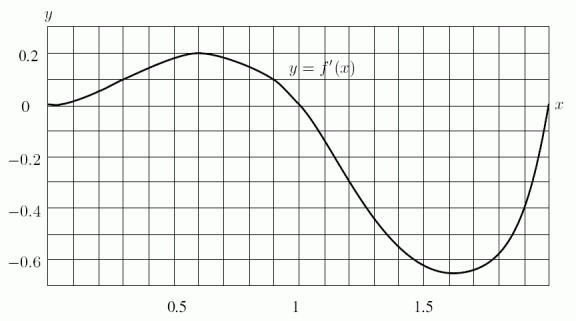
 The following graph represents the rate of change of a function f with respect to x; i.e., it is the graph of   , with   . Find a value a to one decimal place such that   and   . If there is no such value, enter  none .

Correct Answer:

verifed

Verified

Unlock this answer now
Get Access to more Verified Answers free of charge

Related Questions

Unlock this Answer For Free Now!

View this answer and more for free by performing one of the following actions

qr-code

Scan the QR code to install the App and get 2 free unlocks

upload documents

Unlock quizzes for free by uploading documents