The following graph represents the rate of change of a function f with respect to x; i.e., it is the graph of  , with
  . Which of the following are true at x = 1.8? (Check all that apply.)
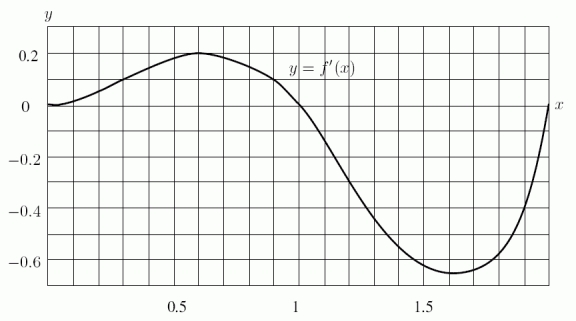
A) f is concave up
B) f is concave down
C) f is increasing
D) f is decreasing
Correct Answer:
Verified
Q109: Given the following graph of 
Q110: The following graph represents the rate of
Q111: Use integration by parts to find
Q112: Given the following graph of
Q113: Calculate Q115: The following figure shows the graph of Q116: Using the following figure, find Q117: Q118: The following figure shows the graph of Q119: Given the values of ![]()
![]()
Unlock this Answer For Free Now!
View this answer and more for free by performing one of the following actions

Scan the QR code to install the App and get 2 free unlocks

Unlock quizzes for free by uploading documents