Multiple Choice
The following figure is the graph of  , the cumulative number of customers served in a certain store during business hours one day, as a function of the hour of the day. About when was the store the busiest?
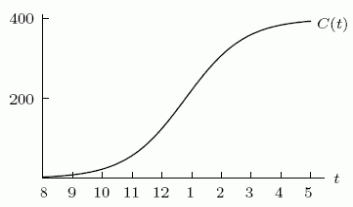
A) 11am
B) 1pm
C) 3pm
D) 5pm
Correct Answer:
Verified
Related Questions
Q1: The height of an object in feet
Q2: Given the following data about the function
Q3: Given the following data about the function


