Short Answer
The growth graph in the following figure shows the height in inches of a bean plant during 30 days. On the 15th day, the plant was growing about _____ inches/day. Round to 2 decimal places. 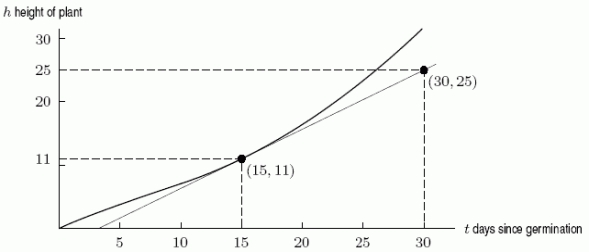
Correct Answer:
Verified
Related Questions
Q6: Let Q7: The graph of Q8: A certain function f is decreasing and Q9: From the following graph, estimate Q10: The height of an object in feet Q12: Given the following data about the function Unlock this Answer For Free Now! View this answer and more for free by performing one of the following actions Scan the QR code to install the App and get 2 free unlocks Unlock quizzes for free by uploading documents![]()
![]()


