Suppose scores from a standardized test measure from 0 to 100. If most scores were in the middle (with few extremely high or low scores), pick the graph that best represents the cumulative distribution function. 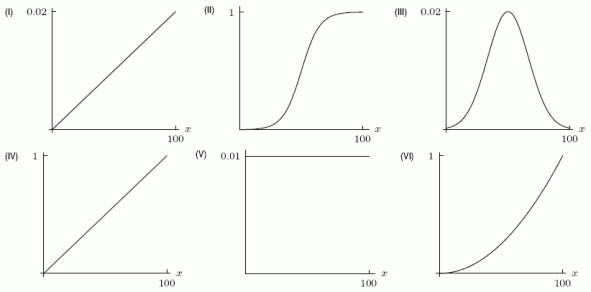
Correct Answer:
Verified
Q42: The annual rainfall for a desert city
Q43: According to data from 2007, the height
Q44: A density function is given by
Q45: The density function for the shelf life,
Q46: In the following probability density function, is
Q48: Which of the following functions makes the
Q49: According to data from 2007, the height
Q50: The following figure shows the distribution of
Q51: A banana plant typically has about 40
Q52: The final exam scores for a calculus
Unlock this Answer For Free Now!
View this answer and more for free by performing one of the following actions

Scan the QR code to install the App and get 2 free unlocks

Unlock quizzes for free by uploading documents