The density function for the shelf life, in days, of a product in a grocery store is shown in the graph. 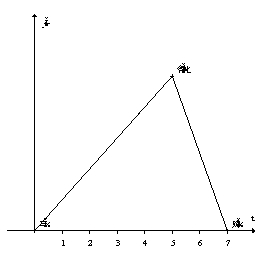 Estimate the median shelf life of the product.
A) 2.25 days
B) 3.25 days
C) 4.25 days
D) 5.25 days
Correct Answer:
Verified
Q40: The life expectancy of a bug can
Q41: The density function for lunch time taken
Q42: The annual rainfall for a desert city
Q43: According to data from 2007, the height
Q44: A density function is given by
Q46: In the following probability density function, is
Q47: Suppose scores from a standardized test measure
Q48: Which of the following functions makes the
Q49: According to data from 2007, the height
Q50: The following figure shows the distribution of
Unlock this Answer For Free Now!
View this answer and more for free by performing one of the following actions

Scan the QR code to install the App and get 2 free unlocks

Unlock quizzes for free by uploading documents