Which of the following graphs best describes the temperature in a large North American city over the course of a year? 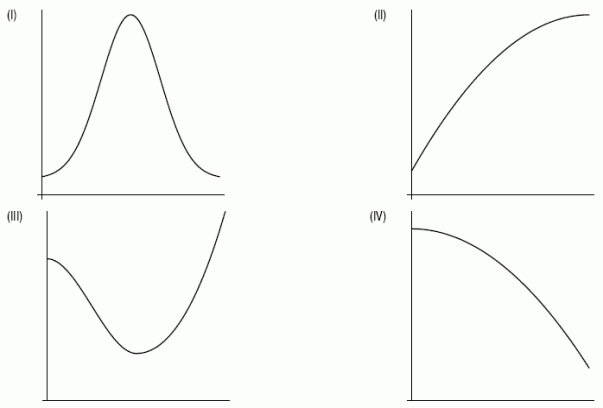
Correct Answer:
Verified
Q2: A quantity y satisfies the differential equation
Q3: A person withdraws money from a trust
Q4: A cup of green tea contains 32
Q5: A quantity Q satisfies the differential equation
Q6: A population of birds introduced onto an
Q7: A quantity T satisfies the differential equation
Q8: A spherical raindrop evaporates at a rate
Q9: Which one(s) of the following are solutions
Q10: Carbon-14 decays at a rate proportional to
Q11: A bank account initially containing $4000 earns
Unlock this Answer For Free Now!
View this answer and more for free by performing one of the following actions

Scan the QR code to install the App and get 2 free unlocks

Unlock quizzes for free by uploading documents