Multiple Choice
Graph 10-4
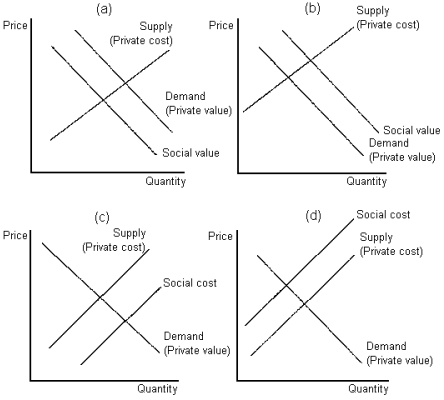
-Refer to Graph 10-4. In the figure shown, which set of graphs depict a situation most likely to benefit from a Pigovian tax?
A) panels (a) and (c)
B) panels (b) and (d)
C) panels (b) and (c)
D) panels (a) and (d)
Correct Answer:
Verified
Related Questions

