Graph 10-4
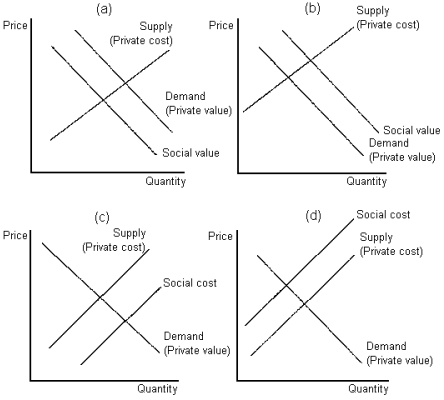
-Refer to Graph 10-4. Which of the graphs shown best depicts the case of a positive consumption externality?
A) panel (a)
B) panel (b)
C) panel (c)
D) panel (d)
Correct Answer:
Verified
Q130: Graph 10-4 Q132: Graph 10-4 Q133: Graph 10-4 Q161: In some cases, pollution permits may be Q166: A Pigovian tax: Q168: Once tradeable pollution permits have been allocated Q170: A broad-based carbon tax may be preferred Q178: When one firm sells its pollution permit Q180: One advantage of allowing a market for Q194: Mobile phones are banned in some public Unlock this Answer For Free Now! View this answer and more for free by performing one of the following actions Scan the QR code to install the App and get 2 free unlocks Unlock quizzes for free by uploading documents
![]()
![]()
![]()
A)allocates pollution to those factories

