Multiple Choice
Solve the problem.
- 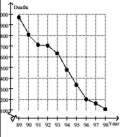
Estimate the average rate of change in tuberculosis deaths from 1996 to 1998.
A) About -0.5 deaths per year
B) About -90 deaths per year
C) About -50 deaths per year
D) About -20 deaths per year
Correct Answer:
Verified
Related Questions
Q33: Use the graph to evaluate the
Q34: Solve the problem.
-When exposed to ethylene
Q35: Solve the problem.
-When exposed to ethylene
Q36: Use the graph to evaluate the
Q37: Use the graph to evaluate the
Q39: Use the graph to evaluate the
Unlock this Answer For Free Now!
View this answer and more for free by performing one of the following actions

Scan the QR code to install the App and get 2 free unlocks

Unlock quizzes for free by uploading documents