The data shows the roundtrip mileage that 43 randomly selected students drive to school
each day. Construct a frequency polygon. Applying a loose interpretation of the requirements
for a normal distribution, do the mileages appear to be normally distributed? Why or why not? 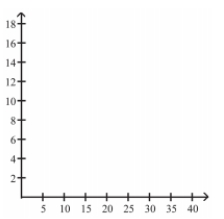
Correct Answer:
Verified
View Answer
Unlock this answer now
Get Access to more Verified Answers free of charge
Q41: Suppose that a data set has a
Q50: The frequency table below shows the
Q50: Describe the differences between a histogram and
Q52: In a survey, 26 voters were
Q53: The following data set represents Heather's
Q54: Describe at least two advantages to using
Q55: A bar chart and a Pareto chart
Q57: Graphs should be constructed in a way
Q58: Kevin asked some of his friends
Q59: The frequency distribution below summarizes the
Unlock this Answer For Free Now!
View this answer and more for free by performing one of the following actions

Scan the QR code to install the App and get 2 free unlocks

Unlock quizzes for free by uploading documents