A manufacturer records the number of errors each work station makes during the week. The data are as follows.
Which of these choices display the correct dotplot?
A) Number of Errors for the Week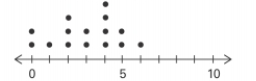
B) Number of Errors for the Week for Workstations for Workstations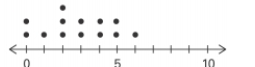
C) Number of Errors for the Week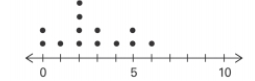
D) Number of Errors for the Week for Workstations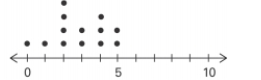
Correct Answer:
Verified
Q18: The following frequency distribution analyzes the
Q19: Analysis of the data from 25
Q20: Q21: Identify the cumulative frequency distribution that Q22: The histogram below represents the number of Q24: The Kappa Iota Sigma Fraternity polled its Q25: The ages of the 45 members Q27: A nurse measured the blood pressure of Q28: The following data show the number Q35: The linear _ coefficient denoted by r
Unlock this Answer For Free Now!
View this answer and more for free by performing one of the following actions

Scan the QR code to install the App and get 2 free unlocks

Unlock quizzes for free by uploading documents