Which of these choices display the correct scatterplot?
A) 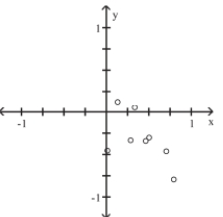
B) 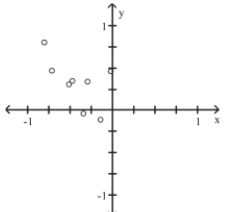
C) 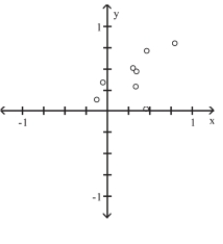
D) 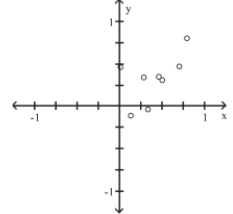
Correct Answer:
Verified
Q15: The attendance counts for this season's
Q16: The following data show the number
Q17: The Kappa Iota Sigma Fraternity polled its
Q18: The following frequency distribution analyzes the
Q19: Analysis of the data from 25
Q21: Identify the cumulative frequency distribution that
Q22: The histogram below represents the number of
Q23: A manufacturer records the number of
Q24: The Kappa Iota Sigma Fraternity polled its
Q25: The ages of the 45 members
Unlock this Answer For Free Now!
View this answer and more for free by performing one of the following actions

Scan the QR code to install the App and get 2 free unlocks

Unlock quizzes for free by uploading documents