Construct the Cumulative Frequency Distribution That Corresponds to the Given 38 39 37 37 44 38 41 38 39 35 42 39 43 37 41
Construct the cumulative frequency distribution that corresponds to the given frequency distribution.
-The following data represent the number of cars passing through a toll booth during a certain time period over a number of days. 38 39 37 37 44 38 41 38 39 35 42 39 43 37 41 
A) 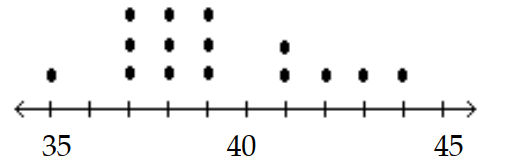
B) 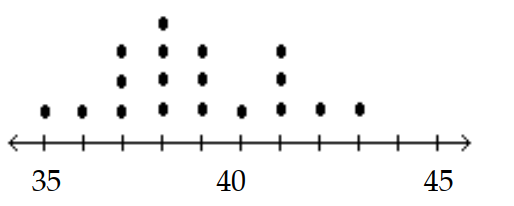
C) 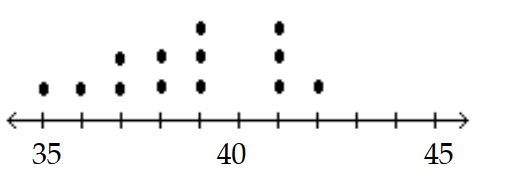
D) 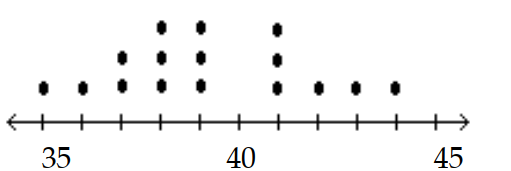
Correct Answer:
Verified
Q46: Use the circle graph to solve the
Q47: Construct the cumulative frequency distribution that
Q48: Construct the cumulative frequency distribution that
Q49: Use the circle graph to solve the
Q50: Find the original data from the
Q52: Find the original data from the
Q53: Use the circle graph to solve the
Q54: Use the circle graph to solve the
Q55: Solve the problem.
-The frequency table below
Q56: Use the circle graph to solve the
Unlock this Answer For Free Now!
View this answer and more for free by performing one of the following actions

Scan the QR code to install the App and get 2 free unlocks

Unlock quizzes for free by uploading documents