Use the circle graph to solve the problem.
-The pie chart below gives the inventory of the women's department of a store. 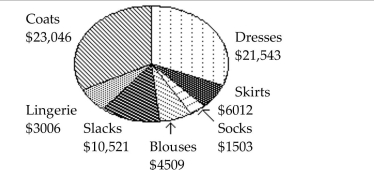 What is the total inventory?
A) $71,643
B) $48,597
C) $70,140
D) $68,637
Correct Answer:
Verified
Q49: Use the circle graph to solve the
Q50: Find the original data from the
Q51: Construct the cumulative frequency distribution that
Q52: Find the original data from the
Q53: Use the circle graph to solve the
Q55: Solve the problem.
-The frequency table below
Q56: Use the circle graph to solve the
Q57: Solve the problem.
-The data shows the
Q58: Find the original data from the
Q59: Construct the cumulative frequency distribution that
Unlock this Answer For Free Now!
View this answer and more for free by performing one of the following actions

Scan the QR code to install the App and get 2 free unlocks

Unlock quizzes for free by uploading documents