Choose the histogram that matches the description.
-The histogram below shows the distribution of pass rates on a swimming test of all children who completed a four week summer swim course at the local YMCA. How many of the courses had Pass rate less than 40 percent? 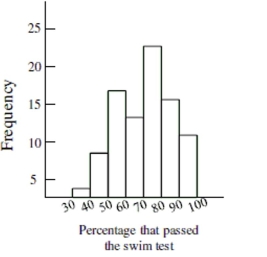
A) Not enough information available
B) About 5
C) About 3
D) About 8
Correct Answer:
Verified
Q16: A group of junior high athletes
Q17: The following graphic was used to visually
Q18: For twenty days a record store owner
Q19: Based on the histogram below, would it
Q20: Choose the histogram that matches the description.
-The
Q22: The graph below displays the number of
Q23: The histogram below is the distribution of
Q24: The graph below displays the number of
Q25: The histogram below displays the distribution of
Q37: In which category was there more variability
Unlock this Answer For Free Now!
View this answer and more for free by performing one of the following actions

Scan the QR code to install the App and get 2 free unlocks

Unlock quizzes for free by uploading documents