The graph below displays the number of applications for a concealed weapons permit in Montcalm County, Michigan, for each of three years. A reported interprets this graph to mean that Applications in 2010 are more than twice the level in 2008. Is the reported making a correct
Interpretation? 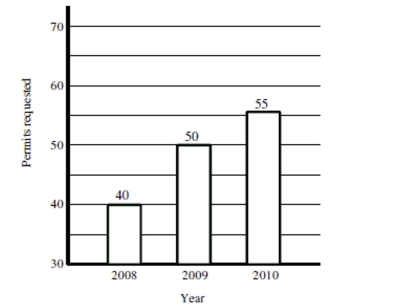
A) Yes. The bar for 2010 is twice the height of the bar for 2008 and the number of applications indicated above the bars shows that applications in 2010 are more than twice the level in 2008.
B) No. Although the 2010 bar is more than twice the height of the 2008, the bars do not begin at 0 applications, so the graph does not correctly represent the data. Fifty-five is not equal to two
Times the number of applications made in 2008.
C) No. The width of the bars is identical, indicating that the number of applications in 2010 is no different from 2008.
Correct Answer:
Verified
Q17: The following graphic was used to visually
Q18: For twenty days a record store owner
Q19: Based on the histogram below, would it
Q20: Choose the histogram that matches the description.
-The
Q21: Choose the histogram that matches the description.
-The
Q23: The histogram below is the distribution of
Q24: The graph below displays the number of
Q25: The histogram below displays the distribution of
Q27: Choose the histogram that matches the description.
-The
Q37: In which category was there more variability
Unlock this Answer For Free Now!
View this answer and more for free by performing one of the following actions

Scan the QR code to install the App and get 2 free unlocks

Unlock quizzes for free by uploading documents