The scatterplot below shows the ice cream sales and daily high temperatures for a threeweek period of time during the summer. Does there appear to be an association betweenthese two variables?
If so, describe the pattern. Be sure to comment on trend, shape, and thestrength of the association. 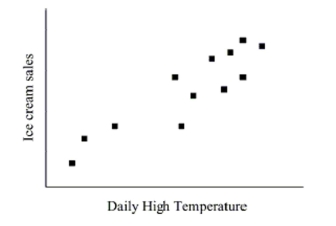
Correct Answer:
Verified
View Answer
Unlock this answer now
Get Access to more Verified Answers free of charge
Q43: Explain in your own words what extrapolation
Q46: If the correlation between whole milk content
Q47: Use the data provided in the table
Q48: Based on the scatterplots below, what is
Q49: The figures below show the relationship between
Q51: The following regression equation was found to
Q53: State the slope and intercept of the
Q55: Use the following information to answer
Q58: Suppose that runner height (in inches)and finish
Q59: Suppose that in the Midwest, it is
Unlock this Answer For Free Now!
View this answer and more for free by performing one of the following actions

Scan the QR code to install the App and get 2 free unlocks

Unlock quizzes for free by uploading documents