A college admissions counselor was interested in finding out how well high school grade point averages (HS GPA) predict first-year college GPAs (FY GPA). A random sample of data from first-year students was reviewed to obtain high school and first-year college GPAs. The data are shown below:
Dependent variable is: FY GPA
No Selector
squared squared (adjusted)
with degrees of freedom
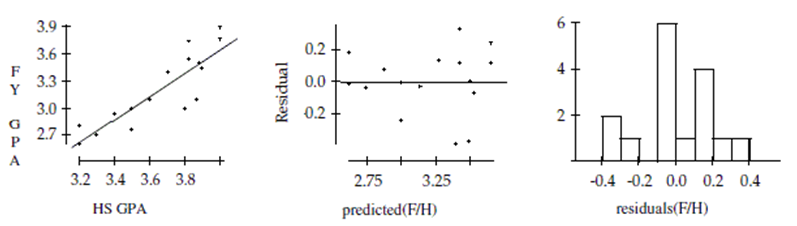
-Create and interpret a 95% confidence interval for the slope of the regression line.
Correct Answer:
Verified
View Answer
Unlock this answer now
Get Access to more Verified Answers free of charge
Q8: A sports analyst was interested in
Q9: Suppose you were asked to analyze
Q10: A college admissions counselor was interested
Q11: Height and weight Is the height
Q12: For the scenario described below, simply name
Q14: As part of a survey, students
Q15: Carnivores A random sample of some
Q16: Voter registration A random sample of
Q17: In the study "The Role of
Q18: Of the 23 first year male
Unlock this Answer For Free Now!
View this answer and more for free by performing one of the following actions

Scan the QR code to install the App and get 2 free unlocks

Unlock quizzes for free by uploading documents