A student wants to build a paper airplane that gets maximum flight distance. She tries
three ways of bending the wing (down, flat, and up) and two levels of nose weight (no and yes
- a paper clip). She randomizes the 12 runs (each condition replicated twice). The analysis
of variance for the 12 runs is shown in the table below along with an interaction plot and
tables of the mean distance for the different wing bends and weights. 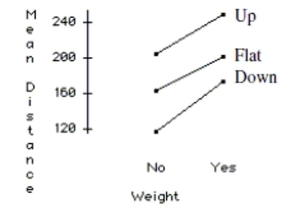
a. Does an additive model seem adequate? Explain.
b. Write a report on this analysis of the data. Include any recommendations you would
give the student on designing the plane.
Correct Answer:
Verified
View Answer
Unlock this answer now
Get Access to more Verified Answers free of charge
Q15: For a class project, students tested
Q17: Here are data about the average January
Q18: The regression below predicts the daily
Q18: Of the 23 first year male
Q19: The regression below predicts the daily
Q20: The regression below predicts the daily
Q22: Here are data about the average
Q23: Here are data about the average
Q24: Three brands of AAA batteries are
Q25: The regression below predicts the daily
Unlock this Answer For Free Now!
View this answer and more for free by performing one of the following actions

Scan the QR code to install the App and get 2 free unlocks

Unlock quizzes for free by uploading documents