For a class project, students tested four different brands of laundry detergent (1, 2, 3, 4) in
three different water temperatures (hot, warm, cold) to see whether their were any
differences in how well the detergents could clean clothes. The students took 36 identical
pieces of cloth and made them dirty by staining them with coffee, dirt, and grass. The 36
pieces were randomly assigned to the 12 combinations of detergent and temperature so
that each combination had 3 replicates. After washing, the students rated how clean the
clothes were from 0 (no change) to 20 (completely spotless). The two factor ANOVA table
is shown below along with an interaction plot and residual plots. 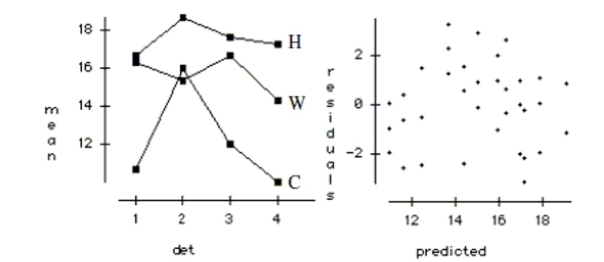
a. Write the hypotheses tested by the Detergent F-ratio. Test the hypotheses and explain
your conclusion in the context of the problem.
b. Write the hypotheses tested by the Temp F-ratio. Test the hypotheses and explain your
conclusion in the context of the problem.
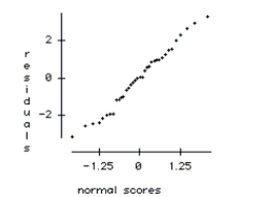
c. Check the conditions required for the ANOVA analysis.
Correct Answer:
Verified
View Answer
Unlock this answer now
Get Access to more Verified Answers free of charge
Q10: Which of the following are NOT
Q11: The problem of collinearity occurs when
A) at
Q12: Here are data about the average
Q13: Here are data about the average January
Q14: When a sum of squares is divided
Q17: Here are data about the average January
Q18: Of the 23 first year male
Q18: The regression below predicts the daily
Q19: The regression below predicts the daily
Q20: The regression below predicts the daily
Unlock this Answer For Free Now!
View this answer and more for free by performing one of the following actions

Scan the QR code to install the App and get 2 free unlocks

Unlock quizzes for free by uploading documents