Use the given paired data to construct a scatterplot.
- 
A) 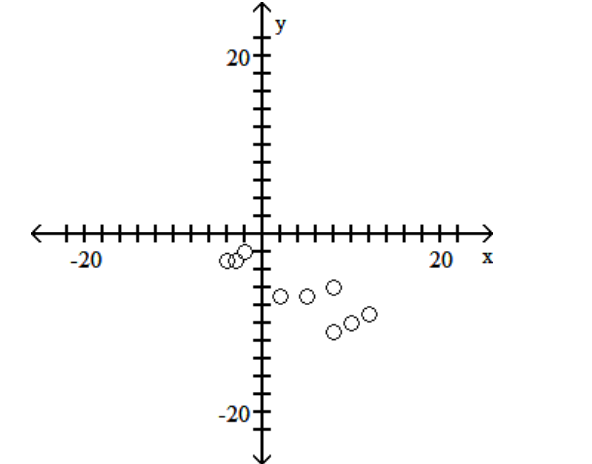
B) 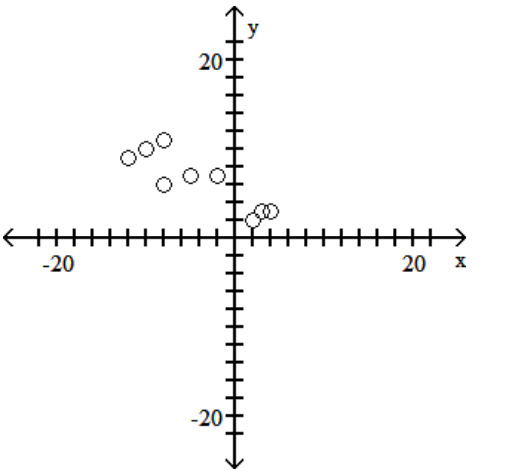
C) 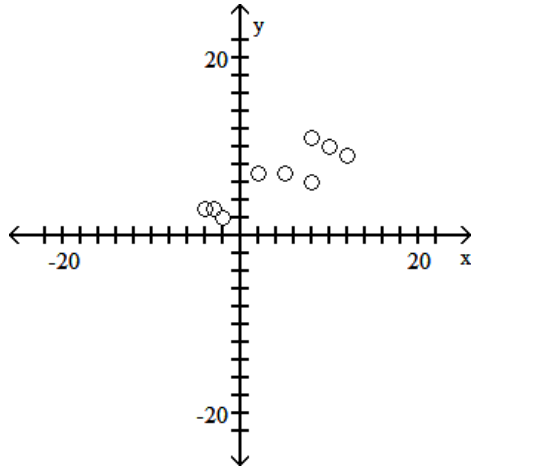
D) 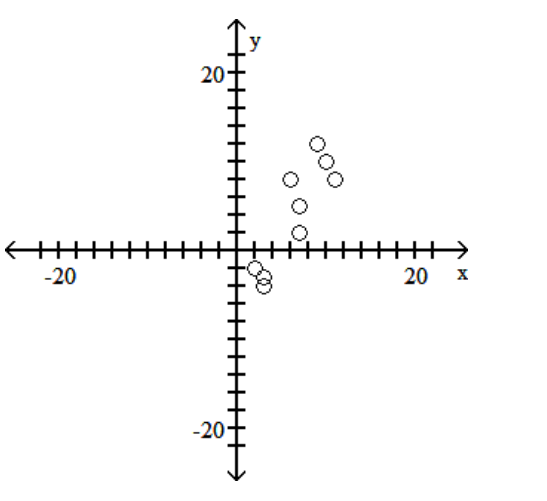
Correct Answer:
Verified
Q28: Use the given data to construct
Q29: The graph below shows the number of
Q31: The frequency table below shows the
Q32: Construct a frequency distribution that includes an
Q35: Solve the problem.
-Suppose that you construct a
Q35: The histogram below shows the distribution of
Q36: Consider the frequency distribution below, which
Q37: Suppose that a data set has a
Q38: Use the given data to construct
Q40: Solve the problem.
-Construct a frequency distribution and
Unlock this Answer For Free Now!
View this answer and more for free by performing one of the following actions

Scan the QR code to install the App and get 2 free unlocks

Unlock quizzes for free by uploading documents